

Bluebird Horizon: APS workforce planning
Bluebird Horizon is AI-enabled strategic workforce planning for the Australian Public Service (APS). It starts from published APS data, so agencies get a useful picture from day one, then deepens with each agency's own data over time.
At a glance
- APS employees
- 198,529
- Published APSC, 30 June 2025
- Agencies covered
- 102
- Published APSC, 30 June 2025
- Job families
- 7
- Headcount, skills and AI task exposure by family
- Published Released by the Australian Public Service Commission (APSC) or another public source
- Modelled Estimated by Horizon from published data
The problem
Agencies need a current picture of their workforce as AI changes the work
The LLM narrates and drafts; it never computes a figure.
Bluebird HorizonPlatform and hosting
AI is changing the work the APS does, and agencies are being asked to plan for it. Australian Government policy now includes the AI Plan for the APS, the Policy for the responsible use of AI in government and the Data, Digital and Cyber Workforce Plan.
Planning well takes a current picture of the workforce and its skills, an honest forecast of where gaps will open, and a way to test options before committing to them.
AI task exposure by job family
Share of task-hours matching automatable or augmentable patterns. Modelled
What it does
One place to see, forecast and plan the workforce
Horizon shows headcount, skills and AI task exposure by job family and agency. It forecasts workforce supply and demand to FY2030 and highlights capability gaps and risks.
Planners can then test scenarios, map talent pathways, generate draft workforce strategies and reports, and ask questions about their workforce in plain language.
AI is framed as capacity to redeploy to priority work, consistent with evidence that generative AI augments more work than it replaces.
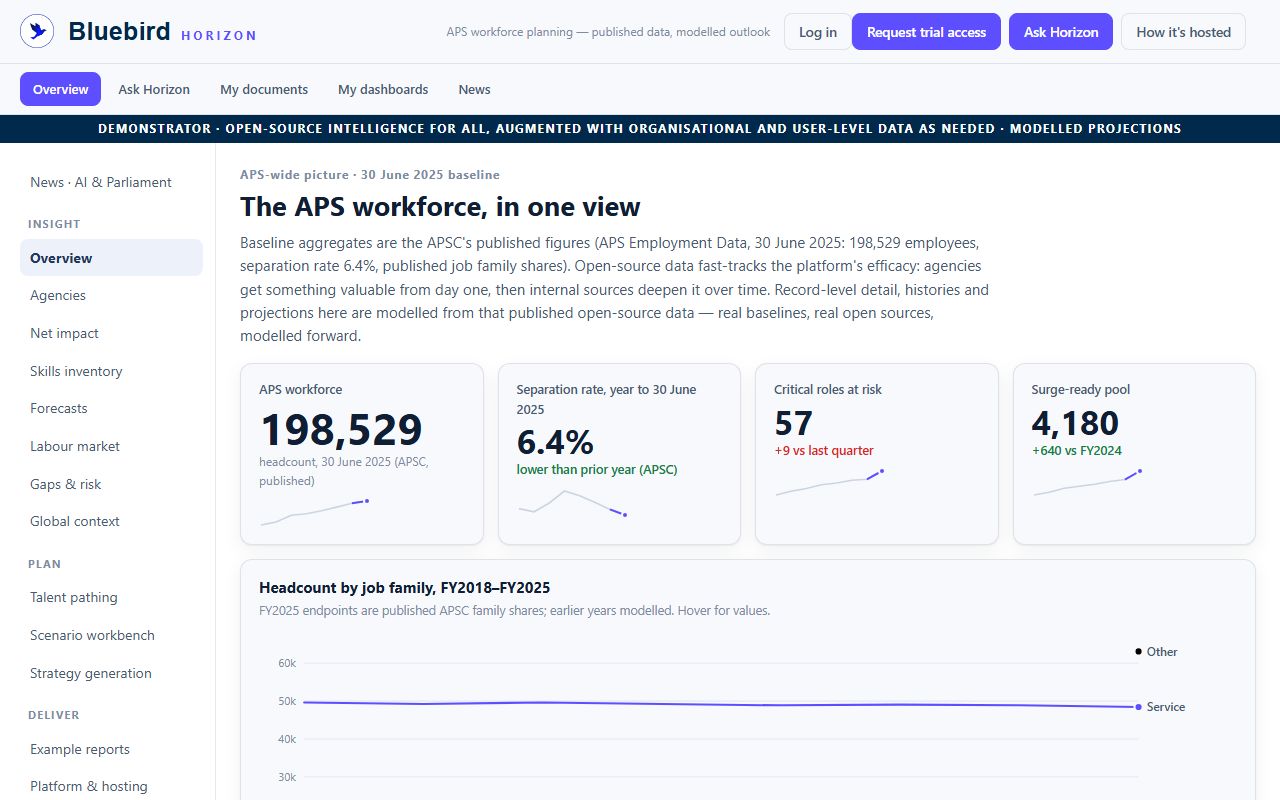
See it in the live demo
Captured from the demonstrator on 9 November 2026. Apart from the published APSC baselines, the figures on the demonstrator are modelled.
How it works
From published baseline to a plan a person owns
Baseline
Start from published APS data, such as APSC employment data, annual-report workforce tables and budget staffing estimates. No agency system needs connecting.
Understand
See headcount, skills coverage and AI task exposure by job family, classification and agency.
Forecast
Project demand and supply to FY2030 with 50% and 90% uncertainty bands, and see the gap between them.
Test
Move the levers planners argue about, such as AI adoption speed, budget growth, attrition and reskilling, and watch outcomes recompute.
Act
Generate gap treatments, a risk register, talent pathways and a draft workforce strategy, which a person reviews and owns.
What the AI does
- Answers questions in plain language through Ask Horizon.
- Drafts strategies, risk registers and narrative reports, grounded and cited on each agency's scorecard.
- Extracts skills from position descriptions, with a confidence score on every match.
What it is built not to do
- Compute a figure: "The LLM narrates and drafts; it never computes a figure." The analytics produce every number.
- Make the final call: a planner owns every strategy, treatment and pathway. Low-confidence skills matches queue for human review.
- Send data offshore: models run on local infrastructure, and no workforce data trains any foundation model.
As stated in the Horizon demonstrator.
How it is built: four planes, cleanly separated
The AI interface is grounded on deterministic analytics, and provenance runs end to end.
- Data planeThree tiers
- Tier 1: open and APSC-held data, from day one
- Tier 2: validated agency file extracts
- Tier 3: optional live HR system connectors
- Analytics planeComputes every figure
- Point-in-time workforce model
- Attrition survival models
- Flow forecasting
- Regime detection
- Scenario modelling
- Adjacency matching
- AI interface planeExplains and drafts
- Model gateway, any language model
- Natural-language questions
- Narrative reporting
- Strategy drafting, grounded and cited
- Hosting planeOnshore only
- Australian infrastructure
- Locally hosted models
- Designed with reference to the ISM
- Read-only access
Inside the product
Every module, from insight to delivery
Insight
Insight
OverviewThe APS workforce in one view
APS-wide headcount by job family from FY2018 to FY2025, AI task exposure by job family, and headcount by classification.
FY2025 endpoints are the APSC's published job family shares. Earlier years and the classification view are modelled from published distributions.
AgenciesEvery agency, its own picture
All 102 APS agencies, each with its published headcount at 30 June 2025, a headcount outlook, its job family mix and its sharpest gaps.
Everything beyond headcount is modelled for the demonstrator. Tier 1 data makes this view possible before any agency system is connected.
Net impactWhat the AI transition is worth, per agency
What the AI transition is worth to each agency by FY2030 once transition costs are paid, shown as capacity that can be redeployed to priority work. Figures are full-time-equivalent capacity, not positions.
The model's coefficients are calibrated to cited evidence and are editable assumptions in the platform. See Data and method.
Skills inventoryA baseline of what the APS can do
A curated skills baseline mapped to the APS Job Family Framework, with coverage by job family, the fastest-moving skills and a check of whether the external market can fill each gap.
Skills are extracted from position descriptions with a confidence score on each match. Matches below the threshold queue for human review. Extraction from job descriptions, role profiles and learning records comes with the pilot and build phases.
ForecastsForecasts that admit what they don't know
Demand and supply projected to FY2030 from the published 30 June 2025 baseline, with 50% and 90% uncertainty bands, and the gap between them charted directly.
Models are validated point-in-time: scored only on data they could not have seen. A detected regime break is marked on the chart.
Labour marketThe market the APS hires from
APS demand set against national supply, using Jobs and Skills Australia's Occupation Shortage List, Internet Vacancy Index and Employment Projections, education completions, skilled migration and the ACS Digital Pulse.
Published figures are tagged as published. Everything derived is labelled as modelled, and the weighting behind the contestedness score is stated.
Gaps and riskRisks surfaced before they bite
- The largest projected skill gaps, ranked by time to impact.
- Single-point dependencies: critical capabilities held by fewer than five people in an agency.
- Options to close each gap across four levers: buy (recruit), build (reskill), borrow (mobility and surge) and bot (automate task content).
- A generated workforce risk register. Planners assign the owners and treatments.
Global contextWhat other governments are doing
How Singapore, the United Kingdom, the United States and OECD guidance compare with Australia, each with the lesson it carries for the APS.
Plan
Talent pathingPathways to roles people are close to
Adjacent-skills matching connects people in transforming roles to future-critical roles they are already most of the way to. A pathway is recommended only when its skills-to-train list is short enough to schedule.
Every recommendation is reviewed by a person before it reaches a conversation with an employee. Aggregated skills-to-train lists can also become a commissioning signal for micro-credentials and graduate streams with university partners.
Scenario workbenchTurn the dials, see the decade
Sliders for AI adoption speed, budget growth, attrition and reskilling investment, with outcomes recomputed as the levers move.
Every saved scenario is stamped with its assumptions and model version, so every run is reproducible and auditable.
Strategy generationThe strategy layer drafts; the analytics decide
A drafted workforce strategy for each of the 102 agencies, grounded on that agency's own scorecard. A person owns the final document.
In the demonstrator the drafts are pre-generated. In production they are drafted live through the model gateway on the same grounding.
Deliver
ReportsStandard reporting, automated
A whole-of-government AI transition scorecard and a one-page scorecard for each agency, computed from the model, with every figure traceable to its page. Worked examples include a strategic workforce plan extract, a quarterly workforce risk brief and a surge readiness assessment. Everything prints for the executive pack.
Ask HorizonQuestions in plain language, reports on request
A chat interface that draws on the APS dataset, the daily news feed and your own library. Ask for a report, such as "write this up as a Word report", and you get a formatted document with charts, saved to the knowledge base.
Chat and report generation are part of a free 7-day trial for Australian government agencies.
Stay informed
AI adoption intelligenceA daily feed, sources linked
A daily feed of news and Australian parliamentary material, including Hansard, Senate estimates and committee hearings where agencies answer for AI adoption and the workforce. The original source is linked on every item.
Data and method
Published baselines, with modelled detail and projections
Baselines are the APSC's published figures. Record-level detail, histories and projections are modelled from published open-source data, and every modelled figure is labelled.
| Source | Used for | Type |
|---|---|---|
| Australian Public Service Commission (APSC) APS Employment Data, 30 June 2025 | Baseline headcount, separation rate, job family shares, agencies and locations | Published |
| Tier 1 open data: APS employment snapshots, Census, annual-report workforce tables and budget staffing estimates | Agency views before any system is connected | Published |
| Tier 2: validated agency file extracts | Deeper, agency-specific detail | Agency data |
| Tier 3: optional live HR system connectors, priced per connector | Ongoing agency detail | Agency data |
| Jobs and Skills Australia, education completions, skilled migration and the ACS Digital Pulse | National labour market and supply | Published |
| Hansard, Senate estimates, committee hearings and news | The daily intelligence feed | Published |
How net impact is modelled
- Task exposure. The share of task-hours exposed to generative AI in each job family (modelled, 27% to 46% across seven job families), anchored to Eloundou et al. (2023).
- Augment or automate. Exposed hours are split 65% augmentation and 35% automation, anchored to Jobs and Skills Australia's Gen AI Capacity Study (2025).
- Adoption reality. Only 60% of the theoretical effect is credited by FY2030, ramping over three years, anchored to the whole-of-government Copilot trial (Digital Transformation Agency, 2024).
- Transition costs. New oversight and data roles, a reskilling drag of about 0.4 FTE-years for about 20% of affected staff, and the tooling, enablement, security and program management the capacity depends on.
Net impact = automation capacity released + augmentation headroom − new roles − annualised reskilling drag
All figures are full-time-equivalent capacity, not positions. The evidence supports reshaping through redeployment and mobility, not headcount cuts. Coefficients are editable assumptions in the platform.
| Figure | What it means | Source and period |
|---|---|---|
| 198,529 | APS employees | Published APSC, 30 June 2025 |
| 13,671 | Growth in the year to 30 June 2025, up 7.4% | Published APSC, 30 June 2025 |
| 102 | APS agencies | Published APSC, 30 June 2025 |
| 586 | Locations | Published APSC, 30 June 2025 |
| 6.4% | Separation rate | Published APSC, 30 June 2025 |
| ~7,400 FTE | Shortfall by FY2030 at current settings | Modelled Horizon |
| 27–46% | Share of task-hours exposed to generative AI, across seven job families | Modelled Horizon |
Trust and security
Hosted in Australia, with locally hosted models
As stated in the demonstrator's platform and hosting section, your data and the models that read it stay onshore.
Common questions
Do we need to connect our HR system to start?
No. Published Tier 1 data gives a useful picture from day one, with no agency work. Validated file extracts and optional live connectors deepen it over time.
Which figures are real and which are modelled?
The APSC's published figures are the real baseline, such as headcount, agencies, locations and the separation rate. Record-level detail, histories, forecasts and impact figures are modelled from published data, and every one is labelled as modelled.
Does the AI produce the numbers?
No. The analytics compute every figure. The language model narrates and drafts, grounded and cited on those figures.
Where does our workforce data go?
It stays in Australia. Horizon runs on Australian infrastructure with locally hosted models, can be deployed into your own cloud subscription, reads source systems read-only, and never uses workforce data to train a foundation model.
Is this about cutting staff?
Horizon does not model redundancies. It measures capacity that can be redeployed to priority work. In its modelling, any fall in headcount comes through natural separations, or the capacity absorbs new demand without growth. How an agency uses that capacity is its own decision.
Can we try it?
Yes. The demonstrator is public. Chat and report generation are part of a free 7-day trial for Australian government agencies.
Get started
From demonstrator to your own data
Explore the demonstrator
Every module runs on real published baselines.
Start a free trial
Australian government agencies can use Ask Horizon and report generation free for 7 days.
Pilot with your data
Add validated file extracts, then optional live connectors, to deepen your agency's picture.
Talk to Bluebird
Talk to us about the demonstrator or a pilot for your agency.
contact@bluebirdadvisory.com.au
Related service: People and Change
Sources
Last reviewed: 9 November 2026.
- Bluebird Horizon demonstrator, horizon.axoquant.com: overview, agencies, net impact, skills, forecasts, labour market, gaps and risk, planning, reports, platform and hosting, and Ask Horizon pages, as at November 2026.
- APSC APS Employment Data, 30 June 2025, as cited by Horizon.
- Bluebird AI Solutions page, bluebirdadvisory.com.au/bluebird-ai-solutions, as at November 2026.