

Freedom of Information at a Glance
Freedom of Information at a Glance is an AI-enabled solution for reporting on Freedom of Information (FOI) performance and compliance across Australian Government agencies and ministers. Every published figure is computed from the source statistics.
At a glance
- Requests received, 2024-25
- 42,759
- Up 25.2% on 2023-24
- Decided within the statutory period
- 72.6%
- 2024-25, down 1.2 points on 2023-24
- Facts behind the figures
- 54,602
- From 7 published workbooks and the OAIC dashboard
The problem
FOI statistics are published, but turning them into a reliable view takes work
Missing data is shown, not invented.
Bluebird FOI InsightsHow to use
Every year, Australian Government agencies and ministers report their FOI activity: requests received, decisions made, and how quickly they were made. Demand rose sharply in 2024-25: 42,759 requests were received, up 25.2% and the highest of the six complete years published.
The statistics arrive as a series of workbooks, one per year, with layouts that vary between releases. Agencies are renamed, courts merge and a year's file can be reissued. Turning that into a reliable view of performance and compliance takes time, and a figure that can't be traced to its source is hard to defend.
FOI requests received, by financial year
Requests received from applicants. 2025-26 covers July to March only, so it is hatched and is not comparable with complete years.
View the data
| Financial year | Requests received | Basis |
|---|---|---|
| 2019-20 | 40,691 | Complete year |
| 2020-21 | 34,345 | Complete year |
| 2021-22 | 33,820 | Complete year |
| 2022-23 | 33,630 | Complete year |
| 2023-24 | 34,153 | Complete year |
| 2024-25 | 42,759 | Complete year |
| 2025-26 | 34,418 | Part year, July to March |
What it does
Dashboards where every figure is traceable
FOI at a Glance turns the published statistics into dashboard pages across four areas: requests, decisions, timeliness and reference.
Filter by agency (any of 235), portfolio, request type (personal or other) and financial year. The charts re-derive from the published facts, and where a selection has no published figure, the page says so.
Each figure carries a basis label so you can tell what window it covers, and a "Where did this come from?" link to its provenance.
Single quarter
One published quarter. The current snapshot is Q1 2025-26.
Financial year
A complete July to June year. All comparisons use complete years.
Part financial year
A year not yet published in full, such as 2025-26 to March. It is never compared with a full year.
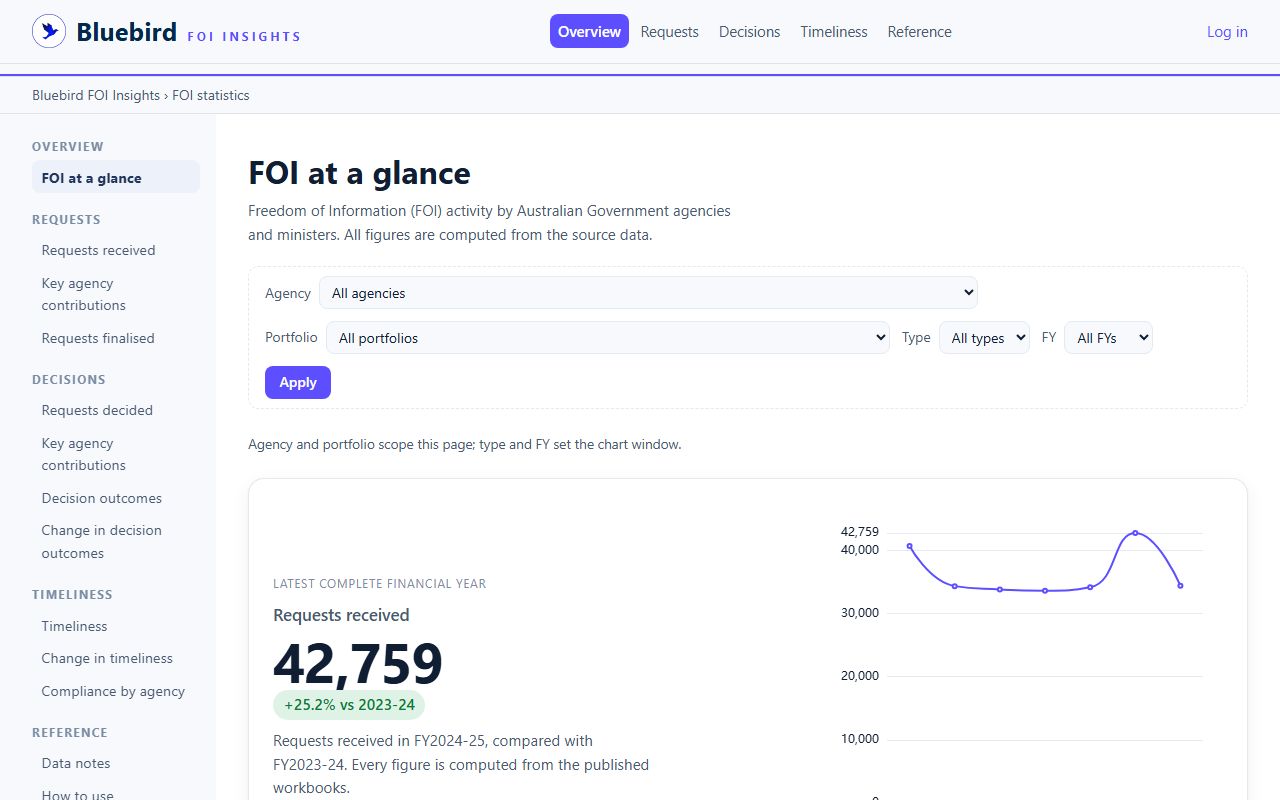
See it in the live demo
Captured from the demo on 9 November 2026.
How it works
Every figure is computed from the source data
The platform computes each number from the Australian Government's published FOI statistics. The only exceptions are eight headline figures transcribed from the OAIC dashboard.
Pin the sources
Seven agency workbooks, 2019-20 to 2025-26, are pinned with their publication date and SHA-256 hash.
Normalise
Each sheet is read into facts by agency, measure and request type. Every batch is stamped with the normaliser version and a content hash.
Check at start-up
The platform re-sums its facts against the published totals every time it starts. A mismatch stops the service rather than showing a wrong page.
Compute
Figures are computed from the facts. The eight Q1 2025-26 headline figures transcribed from the OAIC dashboard are also checked at start-up.
Serve with provenance
Each figure appears with its basis label and a link to where it came from. The same figures are available through a read-only API.
Chat and reports
A signed-in Chat and reports section is available by invitation.
What the platform is built to do
- Keep models out of the figures: the API returns "nothing a model generated", only the canonical data and the figures computed from it.
- Show gaps as gaps: a measure the source doesn't publish shows "No published data for this measure".
- Stop on a mismatch: a failed start-up check stops the service.
As stated in the demo's reference pages.
Inside the product
Every view, and what it shows
Views
FOI at a glanceThe headline view
Headline figures for the latest complete year, year-on-year tables, a "What the data says" summary computed from the same figures as the charts, and a separate panel for the latest single quarter.
A compliance ranking lists agencies by the share of decisions made within the statutory period. Agencies that decided fewer than 30 requests are shown with their rates but not ranked.
RequestsReceived, contributions and finalised
- Requests received from applicants, with requests received on transfer from another agency shown as their own measure.
- Key agency contributions to requests received.
- Requests finalised.
DecisionsWhat was decided, and how outcomes moved
- Requests decided, and key agency contributions.
- Decision outcomes: granted in full, granted in part, refused and withdrawn.
- Change in decision outcomes year on year.
TimelinessDecisions within the statutory period
- Timeliness: the share of decisions made within the statutory period.
- Change in timeliness year on year.
- Compliance by agency.
ReferenceNotes, guidance, API and provenance
- Data notes: the publisher's own notes and disclaimer, reproduced verbatim, plus the platform's reconciliation notes.
- How to use: how to read the basis labels, filters and gaps.
- API access: the endpoints behind every chart.
- Data provenance: every source file, hash, derivation and curation decision.
Chat and reportsSigned-in, by invitation
A signed-in section of the demo. Access is by invitation through Bluebird.
APIThe same figures, as read-only JSON
Every figure and fact behind the charts is available as a read-only JSON API:
/api/: dataset information, measures and source link./api/figures: every computed figure with its basis label./api/facts: the underlying facts, filterable by financial year, measure, request type, agency and quarter./api/measures: the measure groups./api/provenance: the provenance registry, including any one figure's basis.
The public demo API is rate-limited and tuned for demo traffic.
Data and method
Seven pinned workbooks, every decision recorded
The data comes from the FOI statistics dataset on data.gov.au, maintained by the OAIC. Sources were last verified on 13 September 2026.
Where one figure comes from
Requests received, 2024-25
42,759
- Basis
- Financial year
- Source file
- Agency FOI data 2024-25.xlsx
- Published
- 06/11/2025
- SHA-256 (first 12)
973a1ecd2722- Verified
- 13/09/2026
| Covers | Published | SHA-256 (first 12) |
|---|---|---|
| 2019-20 | 19/11/2020 | a4331ed2d8a8 |
| 2020-21 | 26/10/2021 | d76e1cb2b192 |
| 2021-22 | 02/11/2022 | 9b70e7ee6867 |
| 2022-23 | 03/12/2023, reissued 18/06/2024 | 598dd62fa245 |
| 2023-24 | 18/11/2024 | b933826c0a2d |
| 2024-25 | 06/11/2025 | 973a1ecd2722 |
| 2025-26 (Q1 to Q3) | 28/05/2026 | 0ca28e57f061 |
How the data is handled
- Renamed agencies are reported under their current name for all years.
- The 2021 courts merger is reported as new entities, not a rename.
- Trends use published financial years. Quarters are not reconstructed.
- "Requests received" means received from an applicant. Transfers are a separate measure.
- The six-year benchmark uses complete financial years only.
- Agencies below 30 decisions are shown with their rates, not ranked.
| Figure | What it means | Change and context |
|---|---|---|
| 42,759 | Requests received | Up 25.2% from 34,153. The highest of six complete years; the six-year average is 36,566. |
| 39,390 | Requests finalised | Up 19.4% |
| 25,211 | Requests decided | Up 18.1% |
| 72.6% | Decided within the statutory period | Down 1.2 percentage points. The six-year average is 74.5%. |
| 24.8% | Share of decisions refused | Up 0.3 percentage points. The highest of six years; the average is 20.6%. |
Source: data.gov.au Freedom of information statistics, as computed by FOI at a Glance.
Trust and security
Every figure can be traced and checked
Common questions
Where does the data come from?
From the agency FOI workbooks in the Freedom of information statistics dataset on data.gov.au, maintained by the OAIC. Eight single-quarter headline figures for Q1 2025-26 come from the OAIC's published dashboard, because they can't be derived from the cumulative workbook.
How current is it?
The latest complete financial year is 2024-25. 2025-26 is published so far as July to March, and is never compared with full years. The sources were last verified on 13 September 2026.
Does AI produce any of the figures?
No. Every figure is computed from the published data. The API returns nothing a model generated.
Why are some agencies not ranked?
A rate based on a handful of decisions can swing widely. Agencies that decided fewer than 30 requests in either year being compared are shown with their rates but left out of the ranking.
Can we use the figures in our own tools?
Yes. A read-only JSON API exposes the same figures and facts the pages show. The public demo API is rate-limited for demo traffic.
Get started
See your FOI picture
Explore the demo
Filter by agency, portfolio, request type and year.
Ask for workspace access
The Chat and reports section is available by invitation.
Talk to us about your reporting
We can show how the dashboards apply to your agency or portfolio.
Talk to Bluebird
Email us about FOI at a Glance
contact@bluebirdadvisory.com.au
Related service: Data and Artificial Intelligence
Sources
Last reviewed: 9 November 2026.
- Bluebird FOI Insights demo, foi.axoquant.com: FOI at a glance, how to use, data notes, API access and data provenance pages, as at November 2026.
- FOI statistics, data.gov.au, maintained by the OAIC.
- Bluebird AI Solutions page, bluebirdadvisory.com.au/bluebird-ai-solutions, as at November 2026.