

Bluebird NDB Insights
Bluebird NDB Insights is an AI-powered platform for analysing and reporting on Notifiable Data Breaches (NDB). It helps organisations identify trends and risks and supports regulatory reporting. Every figure is computed from statistics published by the Office of the Australian Information Commissioner (OAIC).
At a glance
- Notifications, Jul–Dec 2025
- 670
- Up 12.6% on 595 in Jul–Dec 2024
- From malicious or criminal attacks
- 60.4%
- Of notifications, Jul–Dec 2025
- Notified to the OAIC within 30 days
- 50.6%
- 308 of 609 in-range breaches
The problem
Notifications are rising, and the published record is hard to read as a whole
The model never writes a digit.
Bluebird NDB InsightsAsk
Breach notifications have risen in each published half-year since January to June 2023. They reached 670 in July to December 2025, the highest in the series and 12.6% up on the same half of 2024. Privacy, risk and compliance teams need to understand the trends and meet their reporting obligations.
The published record is hard to read as a whole. Figures are restated as notifications are assessed, reporting moved from quarterly to half-yearly and then to a dashboard, and one recent period was never published.
Notifications per half-year, 2018 to 2025
The OAIC published no report for January to June 2025, so that half stays empty. The first halves of 2018 and 2019 are platform sums of quarterly reports.
View the data
| Period | Notifications | Basis |
|---|---|---|
| January to June 2018 | 305 | Platform sum; scheme began 22 February 2018 |
| July to December 2018 | 507 | Published |
| January to June 2019 | 460 | Platform sum |
| July to December 2019 | 532 | Published |
| January to June 2020 | 512 | Published |
| July to December 2020 | 530 | Published |
| January to June 2021 | 436 | Published |
| July to December 2021 | 460 | Published |
| January to June 2022 | 393 | Published |
| July to December 2022 | 486 | Published |
| January to June 2023 | 407 | Published |
| July to December 2023 | 485 | Published |
| January to June 2024 | 518 | Published |
| July to December 2024 | 595 | Published |
| January to June 2025 | None | Not published |
| July to December 2025 | 670 | Published |
What it does
The whole published record, in one place
NDB Insights brings the scheme's published statistics together: notifications by month and the historical series since 2018, breach detail, and the time taken to identify, respond and notify.
Each figure carries a basis label and a "Where did this come from?" link. A workspace adds three AI-assisted tools.
-
Ask
Describe the dashboard you want. The builder lays out the structure and citations, and the platform computes every figure.
"The model never writes a digit."
-
Chat
Ask questions about the published statistics. Answers are grounded in the data notes and published figures, and every figure carries a source.
For example: "What share were malicious attacks?"
-
Reports
Signed-in users build reports from the same figures. The report builder emits structure and citations, and the platform computes every number.
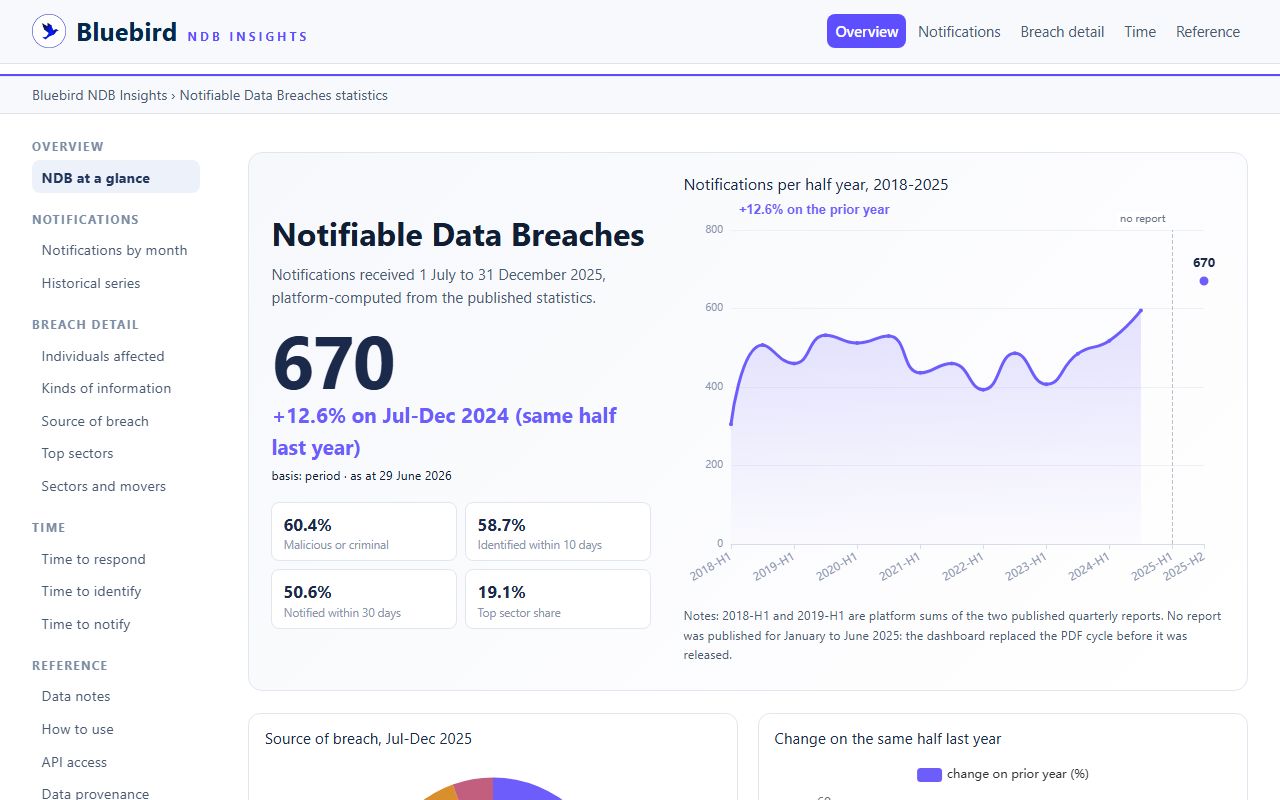
See it in the live demo
Captured from the demo on 9 November 2026.
How it works
How each figure is sourced and checked
Pin the sources
The OAIC's July to December 2025 workbook is pinned by its hash, and the 18 OAIC reports from 2018 to 2024 are transcribed into a registry.
Label every figure
Each figure is marked as a published period figure, a published month figure, or a platform sum of published figures.
Keep restatements visible
When a later report restates a figure, the latest value is shown, the first-published value is kept beside it, and the restating report is named.
Check at start-up
The platform re-sums its facts against hand-verified published totals for every period from 2018 to 2025. A mismatch stops the service.
Serve with lineage
Every figure links to where it came from, and the same figures are available through a read-only API.
What the AI does
- Turns a plain-language description into a dashboard layout with citations.
- Answers questions grounded in the data notes and the published figures.
- Drafts the structure of reports built from the same figures.
What it is built not to do
- Write a number: the platform computes every figure.
- Give legal advice: or say whether a specific incident is an eligible data breach.
- Identify anyone: the chat refuses requests that would identify a breach, an entity or an individual.
- Fill a gap: an unpublished period stays a disclosed gap.
As stated in the demo's reference pages.
Inside the product
Every view, and what it shows
Views
NDB at a glanceThe latest period on one page
Notifications for the latest half-year and the change on the same half last year, the main sources of breach, the share identified within 10 days and notified within 30 days, a "What the data says" summary and the historical trend.
NotificationsBy month, and the series since 2018
- Notifications by month from the latest workbook.
- The historical series from 2018, including a restatement table that shows first-published and latest values.
Breach detailWho and what was affected, and how
- Individuals affected: published in ranges. The large-breach threshold changed over the series, so it travels with each figure.
- Kinds of information: contact, identity, financial, health, tax file numbers, other sensitive information and, from 2025, digital ID.
- Source of breach: malicious or criminal attack, human error and system fault.
- Top sectors, and sectors and movers.
TimeTo identify, respond and notify
Time taken in calendar days from when the entity became aware of the incident, from the workbook's bands. The 30-day window reflects the assessment obligation in section 26WH of the Privacy Act. Where no whole-period median is published, no median is shown.
ReferenceThe definitional authority for every figure
- Data notes: what the figures count, the categories, publication cadence and known source quirks. The chat answers are grounded in this text.
- How to use, API access and data provenance.
APIThe same figures, as read-only JSON
/api/: dataset information, dimensions and keys./api/figures: every platform-computed figure with its basis./api/facts: the underlying facts, filterable by period, month, dimension, category and measure./api/measures: the dimensions and their measures.
The API never returns a number the platform did not compute from the pinned sources.
Data and method
Published counts, labelled and reconciled
Every figure carries the as-of date of the report that published it. Coverage was checked against every readable source on 12 September 2026.
Where one figure comes from
Notifications, July to December 2025
670
- Basis
- Period
- Source file
- NDB Data 1 July 2025 to 31 Dec 2025.xlsx
- As at
- 29/06/2026
- SHA-256 (first 12)
18a1b7fecd90- Published on
- data.gov.au
| Source | Used for |
|---|---|
| OAIC Notifiable Data Breaches workbook, 1 July to 31 December 2025, as at 29 June 2026 (data.gov.au) | The latest period and monthly figures |
| OAIC Notifiable Data Breaches reports, 2018 to July–December 2024 (18 reports) | The historical series, and timeliness trend lines from 2020 to 2023 |
| Platform sums of published figures | The 2018 and 2019 first-half totals, labelled as derived |
Source of breach, July to December 2025
Share of the 670 notifications. The three groups do not sum to 100% because the OAIC workbook publishes "Other" and "Currently unknown" only monthly.
Gaps and quirks, disclosed
- No OAIC report was published for January to June 2025, when a dashboard replaced the report cycle. That half stays a gap.
- No whole-period timeliness figure is published for 2024, so that stretch of the trend stays a gap.
- In the latest workbook, source-of-breach rows sum to 673 against a published total of 670. The difference is disclosed, not reallocated.
- Earlier reports count multi-entity breaches differently, so the history marks where comparisons stop being like-for-like.
| Figure | What it means |
|---|---|
| 670 | Notifications received, up 12.6% on 595 in the same half of 2024 |
| 60.4% | Notifications where a malicious or criminal attack was the source |
| 37.8% | Cyber incidents |
| 29% | Human error |
| 5.2% | System faults |
| 58.7% | Breaches identified within 10 days (349 of 595 in-range breaches) |
| 50.6% | Breaches notified to the OAIC within 30 days (308 of 609 in-range breaches) |
Cyber incidents (253 of 670) are one part of malicious or criminal attacks (405 of 670), alongside social engineering or impersonation (88), rogue employee or insider threat (34), and theft of paperwork or storage devices (30). Source: OAIC NDB statistics via data.gov.au, as computed by NDB Insights.
Trust and security
Aggregate data only, with set limits on the chat
Common questions
Does it give legal advice?
No. It answers questions about the published statistics, not about your obligations under the Privacy Act, and it won't say whether a specific incident is an eligible data breach.
Why do 60.4% and 37.8% both describe attacks?
The OAIC's "malicious or criminal attack" category includes cyber incidents, rogue employees and insider threats, social engineering or impersonation, and theft of paperwork or storage devices. In July to December 2025, cyber incidents made up 253 of the 405 malicious or criminal notifications.
Why is January to June 2025 missing?
The OAIC published no report for that half: its statistics dashboard replaced the report cycle. Rather than read values off a chart, the platform shows the period as a disclosed gap.
How current is the data?
The latest published period, July to December 2025, is on the site from the OAIC workbook as at 29 June 2026. Coverage was last checked on 12 September 2026.
Can we use the figures in our own tools?
Yes. A read-only JSON API returns the same platform-computed figures and facts, and never a number the platform did not compute from the pinned sources.
Get started
From the public record to your own reports
Explore the demo
Every page is open, with sources linked.
Try the chat
Ask about notifications, sources of breach or sectors.
Build your reports
Talk to us about using Ask and Reports with your team.
Sources
Last reviewed: 9 November 2026.
- Bluebird NDB Insights demo, ndb.axoquant.com: NDB at a glance, data notes, how to use, Ask, Chat, Reports and API access pages, as at November 2026.
- OAIC Notifiable Data Breaches statistics, data.gov.au.
- Bluebird AI Solutions page, bluebirdadvisory.com.au/bluebird-ai-solutions, as at November 2026.